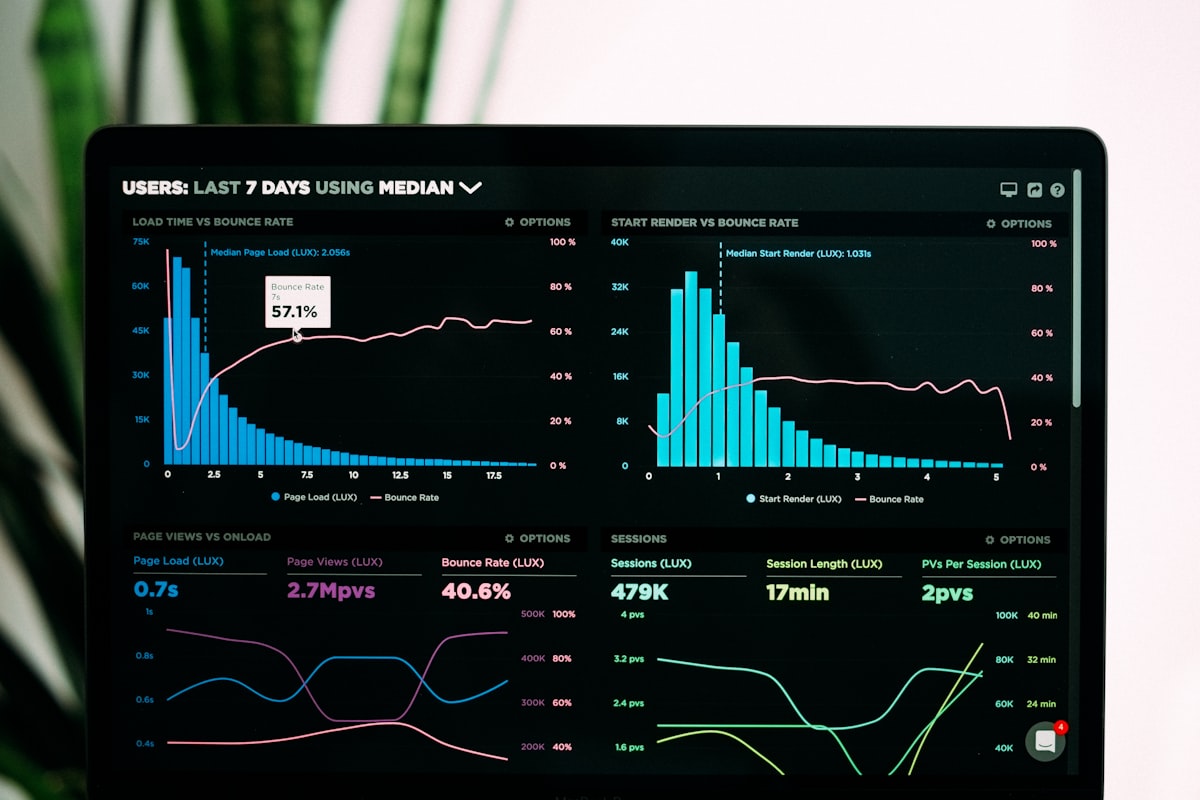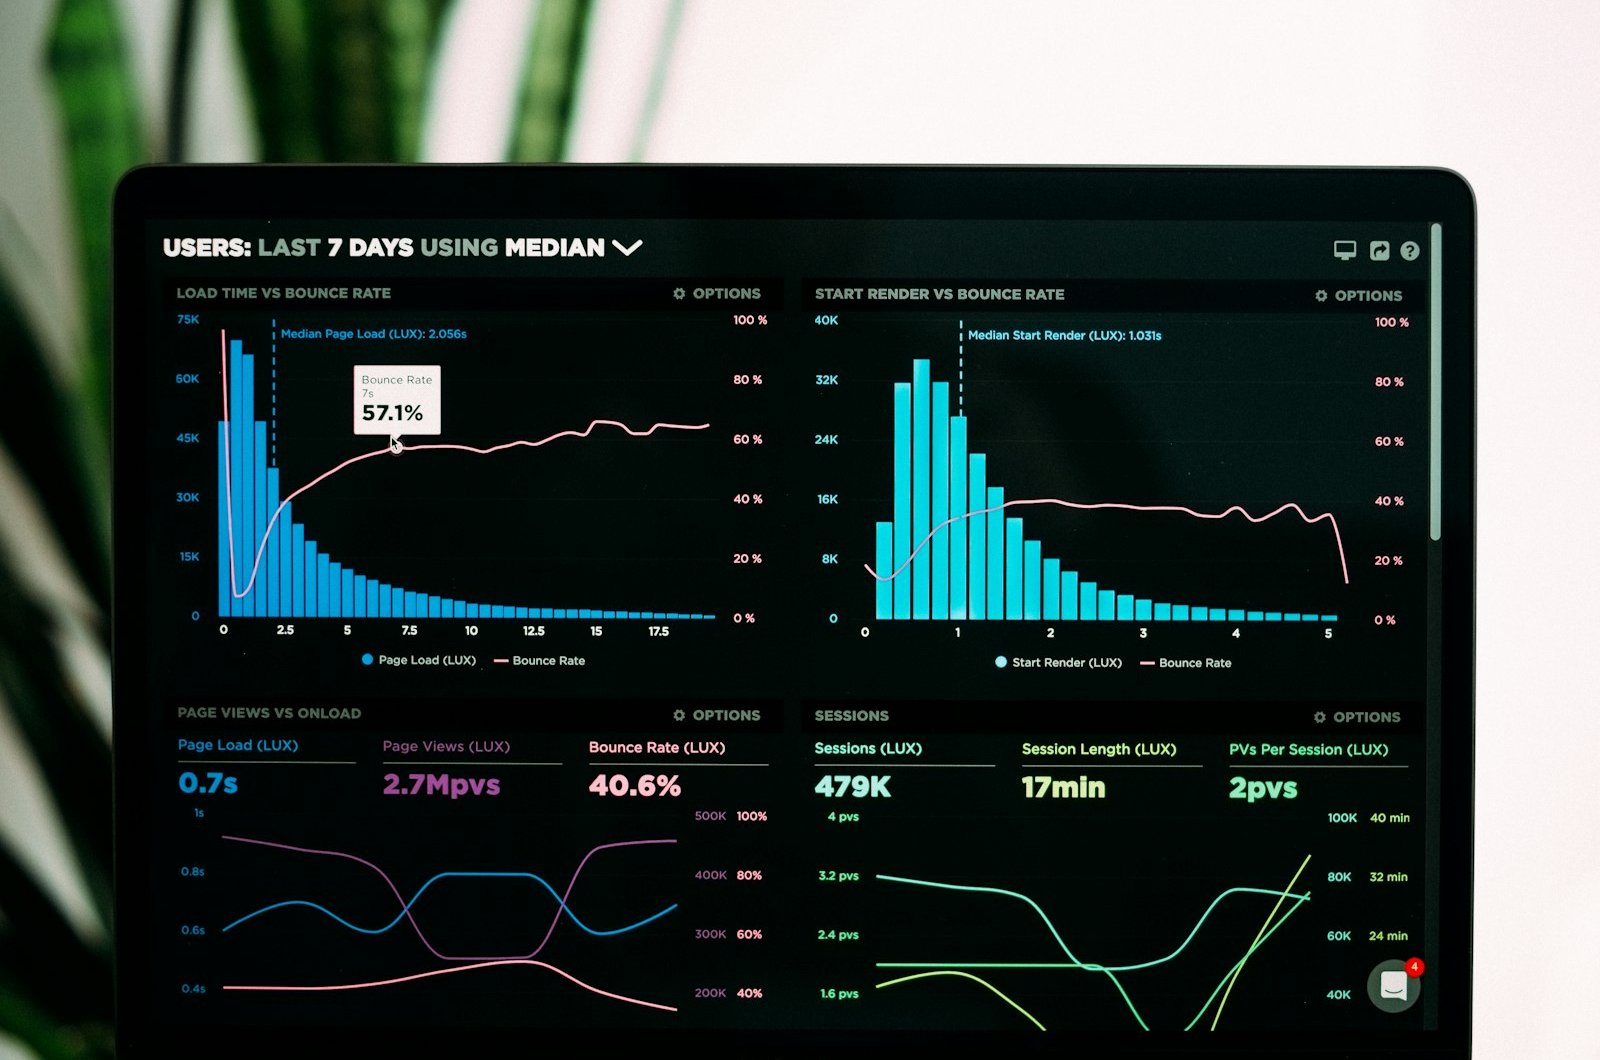
Pick one of your stores. Open your dashboard. Pull the conversion rate, the traffic count, the average ticket, and the dwell time for last Saturday. You already have those numbers. Now tell me what was playing on the speakers at 2 PM and whether it helped or hurt any of them.
Nobody you pay can answer that question. Your music vendor will send you a report that confirms the service was running. Your analytics vendor will send you a report that confirms customers were in the store. The two reports never meet. The music in your stores is the single most consistent element of the customer experience, and it is the least measured variable on your floor.
How do you know if your store music is working? #
Commercial music services sell delivery. They prove the sound came out of the speakers. They report play counts, station selections, schedule adherence. An operations team inside the vendor watches for outages.
None of that reporting touches your sales numbers. No vendor I have spoken with writes a line in their contract that says the music changed conversion by X percent or moved dwell by Y minutes. Vendors sold you the audio channel. Answering whether the audio is working was never part of what they sold.
Most operators have accepted this trade for years. Staff complains about the music, customers do not mention it, a regional manager changes the station once in a while, and the line item keeps getting paid.
A walk-through you can run this week #
Before you buy anything or change vendors, walk your stores. Pick three locations, different formats if you have them. Spend twenty minutes in each one without announcing yourself. Ask these questions as you stand on the floor.
What is playing, and does it belong in this store. A downtown flagship and a suburban mall location should not sound identical. If they do, somebody upstream is treating your brand as a zip code. Note the tempo. Note the vocals. Note whether the music matches the merchandise you are looking at.
Is the volume right for the traffic. Saturday at 2 PM and Tuesday at 10 AM are not the same room. If the level is the same at both, nobody is paying attention.
What is the staff doing with it. Ask the manager. If the answer is that they turn it off, turn it down, or swap the station when corporate is not visiting, your vendor is delivering audio your team does not want customers to hear. That is a data point.
The four numbers to put next to the walk-through #
You do not need a new tool to start. You need four numbers you almost certainly already pay for.
Dwell time. How long the average customer stays in the store. Traffic counters at the door give you this, and if you have RetailNext or Sensormatic you have it by hour. Longer dwell in a retail environment correlates with larger baskets more often than not.
Conversion rate. Visitors who buy, divided by visitors who came in. Your POS and traffic counter together give you this. A conversion rate that sags at the same hour every day is telling you something about that hour. Music is one of the variables in that hour.
Average ticket. What each paying customer spent. Areni and Kim published work thirty years ago showing that shifting the music in a wine store raised the average wine price selected by customers. The mechanism was shopper perception of what the store was for. Your music is telling your customer what kind of store yours is, whether you meant it to or not.
Return visit frequency. How often the same customer comes back. If you have a loyalty program, you have this. If you have clienteling, you have this. A retail environment customers want to stand inside is a retail environment they come back to sooner.
The music in your store is the single most consistent element of the customer experience, and it is the least measured variable on your floor.
What to do with the answer #
If your walk-through and your four numbers agree that something is off, you have a defensible reason to take the question into your next QBR with the vendor. Ask them, on the record, what their music did to your sales last month. Ask them how they would prove it. Watch what happens.
Most vendors will redirect to schedule adherence and uptime. A few will acknowledge that the question is real and that they cannot answer it. Both responses are useful. They tell you what you are actually paying for.
If what you are paying for is delivery with no accountability, you have two choices. You live with it, which is what most retailers do. Or you start treating the audio in your stores the way you treat every other element of the customer experience. Measured, intentional, and on the hook for an outcome.
The numbers side of this argument is laid out for finance teams here.