Average order value is the metric every operator says they want to move and most attempt to move with the longest, most expensive levers. New product mix. New planogram. New staff training program. Each is real. Each takes a quarter to ship and another quarter to read.
The cheapest lever in the building moves the same number, can be tested in two weeks, and is the one most operators have never deliberately touched.
This is a field guide to the five levers that actually move retail AOV, ranked by where the operational lift sits.
What is a typical AOV in retail? #
AOV benchmarks are category-specific.
Fast-fashion and value retail. $25 to $60 per transaction. The format is built around impulse and turnover. A 5 to 10 percent AOV lift here is significant.
Specialty apparel, beauty, accessories. $60 to $150. Browsing-driven categories where customers come in expecting to consider before they decide. A 10 percent AOV move is the difference between an okay quarter and a strong one.
Home goods, sporting goods, premium specialty. $120 to $400. Larger consideration cycles, larger basket potential, more upsell math.
Furniture, mattress, jewelry, big-ticket. $800 to $4,000-plus. AOV here is so dependent on close rate and assortment that the percentage discussion gets misleading.
The right comparison is not against an industry average. It is against your own AOV trend over the last six quarters and against the operators in your direct trade area. Both are usually knowable from data you already have.
Lever 1: Product mix and assortment #
The longest-cycle lever. Adjusting your assortment toward higher-margin or higher-price-point SKUs moves AOV directly. It also takes two to four quarters to plan, source, and merchandise.
This is the work merchandising teams do. It is also where most operators look first when AOV stalls. The instinct is correct. The problem is timing. By the time the new mix is on the floor, the AOV question may have shifted.
Worth doing. Slow to ship. Not the lever to start with if you need movement this quarter.
Lever 2: Visual merchandising and adjacency #
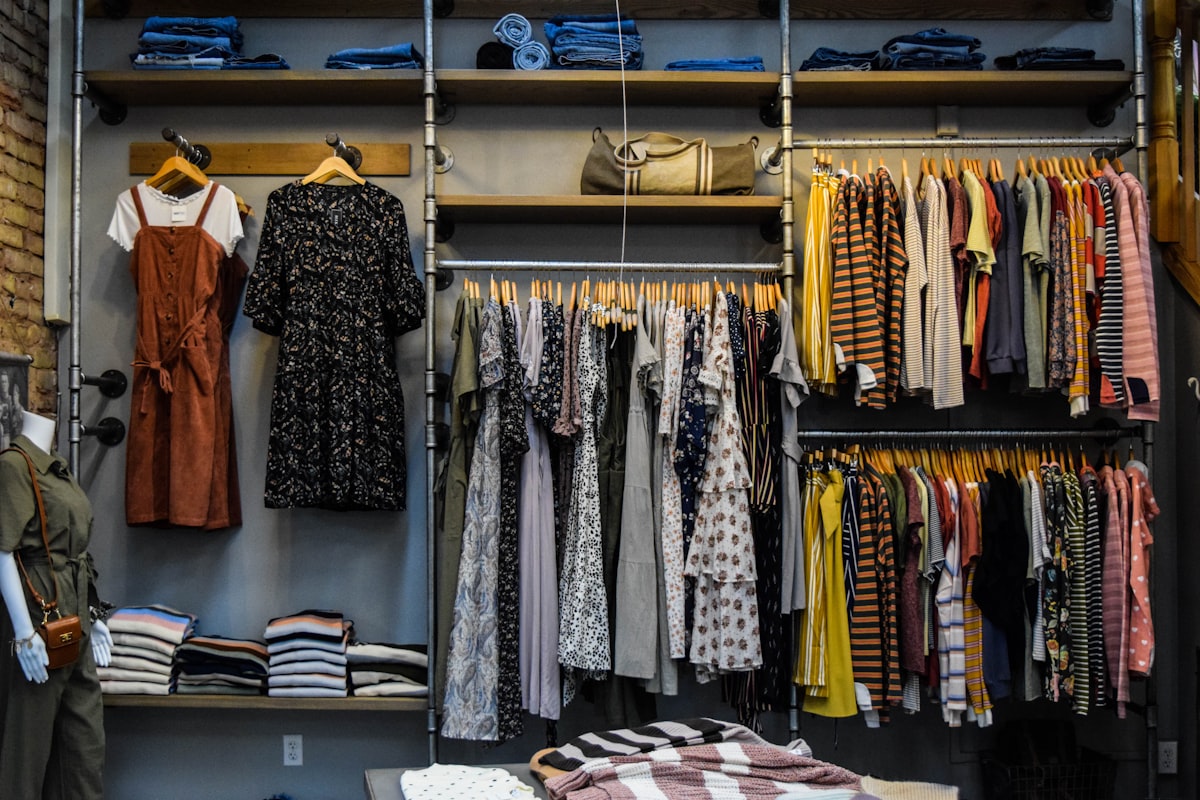
Adjacency planning — placing complementary items together so attach happens in the same trip — is the most direct in-store driver of basket size. A customer buying a dress sees the matching belt, sees the matching shoes, and the basket compounds.
This is well-trodden ground in larger fleets with dedicated VM teams. It is unevenly applied in smaller chains and almost never revisited in single-location operators. The same end-cap that has been on the same wall for two seasons is leaking AOV every week.
Cycle time: weeks, not quarters. Operational cost: an afternoon of moving fixtures.
Lever 3: Staff training on suggestive selling #
Trained staff move AOV through suggestion. Untrained staff ring up exactly what the customer brought to the counter.
The challenge with this lever is consistency. Suggestive selling works when associates are confident, well-versed in the product line, and incentivized correctly. It fails when any of those three is missing, and most multi-location operators have a wide variance across stores.
Cycle time: a quarter to train, ongoing to maintain. Worth the investment, but not the lever you reach for if you want a clean two-week test.
Lever 4: The audio environment #
The cheapest AOV lever is the one most operators have never deliberately set.
In 1993 Charles Areni and David Kim published a study from a wine shop. They alternated the background music between classical and Top 40 across matched conditions. Customers shopping with classical music in the background spent more per bottle than customers shopping with Top 40. Same products. Same prices. Same store. Same time of day. The audio environment moved the average ticket.
The mechanism is what behavioral psychologists call priming. The classical music cued an upmarket context — formal, considered, high-end — and customers anchored their spending decisions to that frame. They did not feel manipulated. They reported the same satisfaction with the trip. The number moved without the customer noticing why.
The effect has been replicated across multiple retail categories in the three decades since. The mechanism is not unique to wine. It is unique to upmarket cueing in any category where price acceptance is partly a context call.
The reason this lever is undershot is not that it does not work. It is that the commercial music industry sells you a catalog and a genre picker, then reports on play counts. Operators were never given a tool that lets them pick the AOV outcome and have the audio configured to support it.
Lever 5: Friction at upsell moments #
The fitting room with no associate. The accessory wall blocked by clearance fixtures. The checkout counter with no eye-level upsell display. Each is a moment where the operator has built the path for the basket to grow and then put a wall in front of it.
Friction reduction at upsell moments is the lever that operations teams handle well when they think to look. It usually rewards a walking audit more than a strategic project.
Same products. Same prices. Same store. The audio moved the average ticket.
How to test this in two weeks #
AOV is one of the easiest retail metrics to read cleanly. Every POS reports it natively. Week-over-week comparison filters out most of the seasonal noise that makes month-over-month tricky.
Pick a baseline week. Pull AOV by time of day and by day of week. Note any promotions, weather anomalies, staffing changes. That is your control.
Change one variable for the next two weeks. The audio environment is the easiest because it has no operational cost and no inventory risk — no fixture moves, no restocking, no labor overhead. Pull AOV the same way at the end of week three.
If AOV moved by more than your normal week-over-week noise band, you have a signal worth extending to a full quarter. If nothing moved, you have learned that for your customer profile and product mix, audio priming was not the binding constraint, and you can re-allocate to one of the other four levers without spending capital first.
Where to start this week #
Three actions, in order.
Pull six weeks of AOV by time of day. Get familiar with the noise band before you start changing anything. Most operators have not actually looked at AOV at this granularity in months.
Walk your stores and listen. Stand at the door for two minutes on a Saturday afternoon. Ask: does the music match the price point I want customers to anchor to? Does it sound like a $40 store or a $140 store? Did anyone choose this?
Run a free audio pilot. Entuned Free gives you outcome-tuned music for no credit card, no time limit. Run it for two weeks against the baseline. If AOV moves, you have evidence. If it does not, you have learned which lever is not the binding constraint, which is also worth knowing.
For the strategy hub on this topic — the full playbook for moving average order value in physical retail — see how to increase average order value in retail stores. For more on the priming mechanism behind upmarket cueing, see luxury priming for non-luxury brands. For why dwell time and AOV are not the same conversation, see longer visits don’t mean bigger receipts. For the broader case on retail music ROI, see how to measure the ROI of in-store music. The full pricing page walks through what each tier includes.