You spent six figures on the buildout. You negotiated the lease. You hired visual merchandisers to make sure the product looks right from the door. And then someone plugged in a Mood Media box and hit play on a playlist that could belong to literally any store in America.
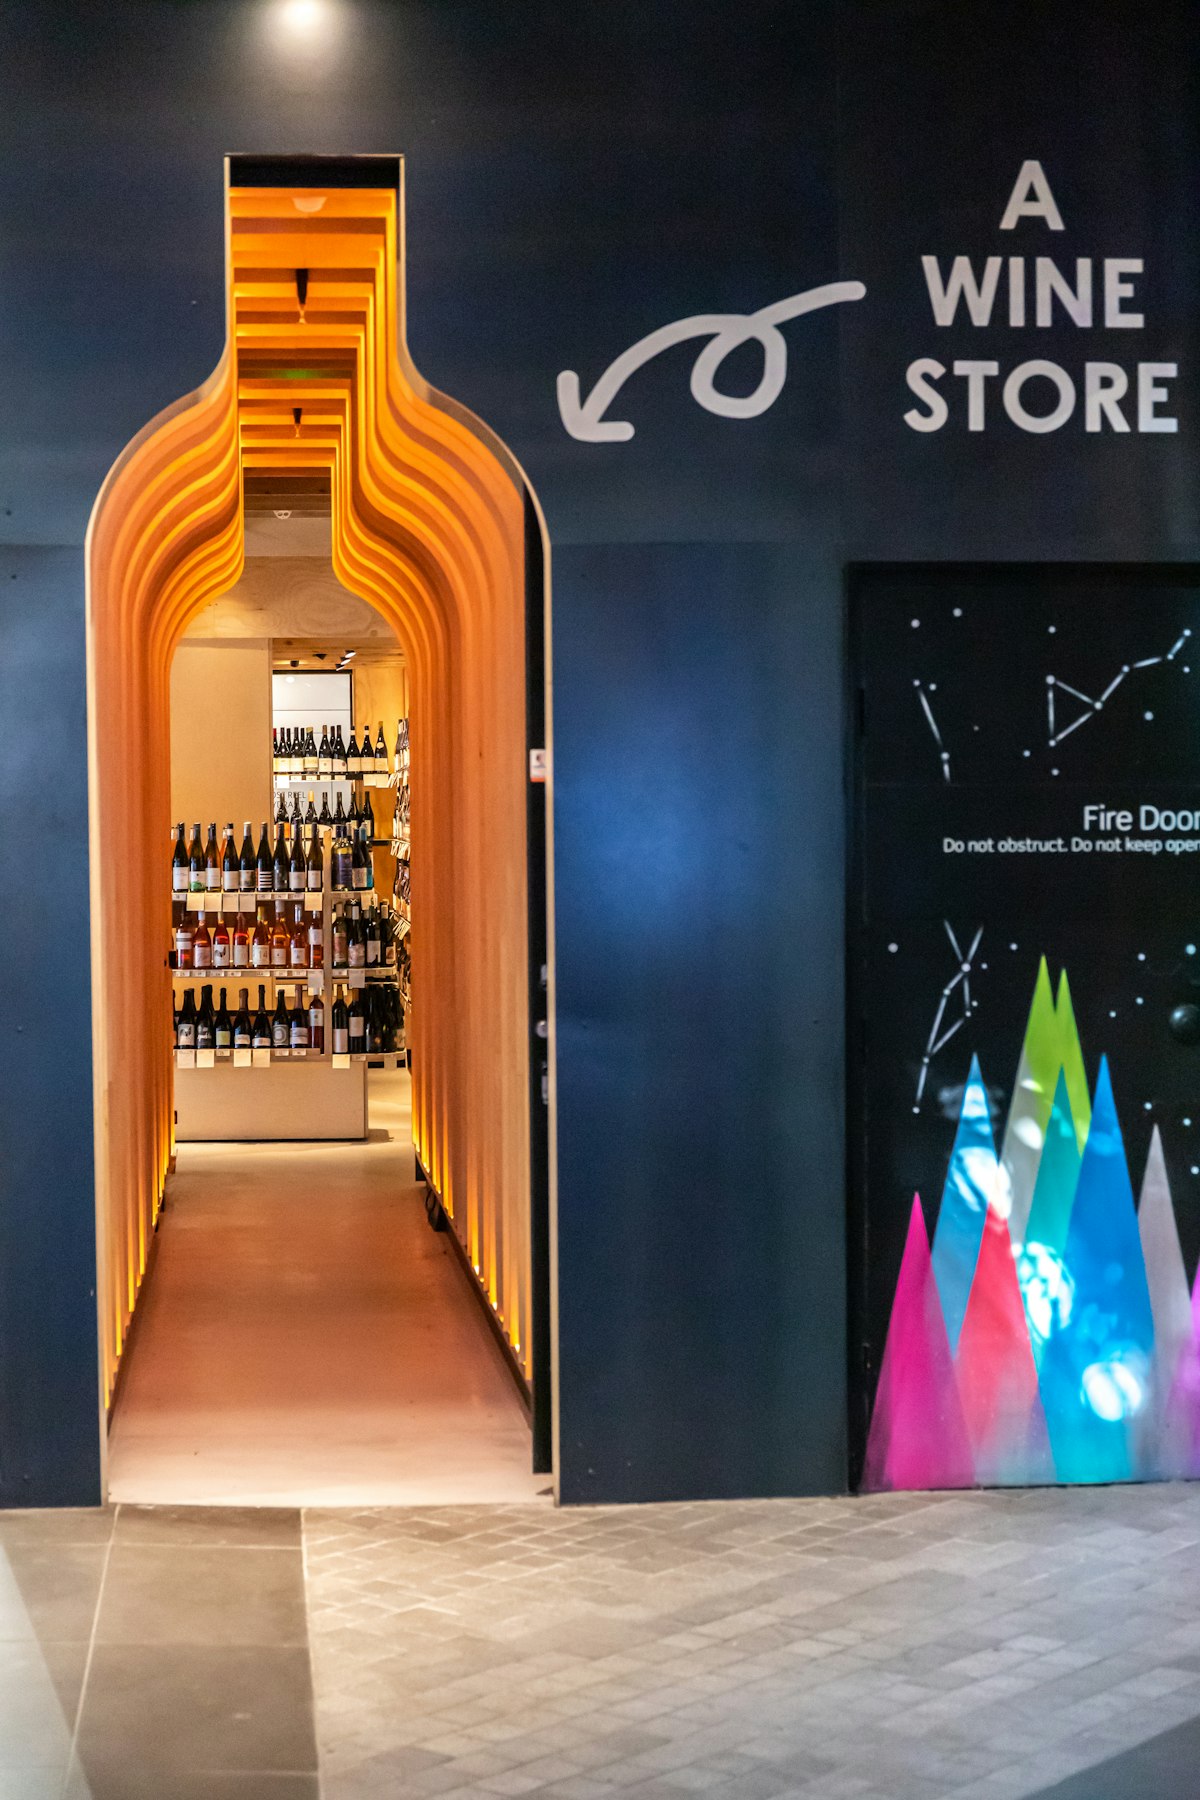
There is a number buried in the retail psychology literature that most operators have never seen. It comes from a study in a wine shop in the early 1990s, and researchers have replicated it enough times since then that arguing with it feels like arguing with gravity.
When the music in a retail space matches the identity and values of the customers shopping there, willingness to pay goes up 8 to 12 percent. Same products on the shelves. Same prices on the tags. Same staff on the floor. Customers just pay more.
Areni and Kim published the foundational study in 1993, looking at wine retail specifically. North, Hargreaves, and McKendrick extended it in 1999 and showed the effect held across product categories and store types. At this point, “does music affect willingness to pay” is a settled question. The research question that remains is which music, for which customer, and by how much.
How much revenue is bad music actually leaving on the table? #
Most retail music providers are catalog businesses. They organize licensed tracks into moods and genres and let operators pick from a menu. The assumption built into that model is that “upbeat” or “relaxed” or “contemporary” is a meaningful enough description of what a store needs.
Your customer is not “upbeat.” She is a 34-year-old woman who grew up on Lauryn Hill and shops at your store because it feels like it was made for someone like her. The music that makes her stay longer and spend more is specific to her, and it is different from the music that does the same for someone else in a different store three miles away.
Catalog providers were built to fill silence. They do that well. They were not built to match music to a customer’s identity at the level the research describes.
What 8% Actually Looks Like on Your P&L #
Run the math on your own operation. Take your average transaction value. Apply 8 percent. Multiply by the number of transactions in a month across your locations. That is the number sitting in the research, waiting for someone to go collect it.
It does not require more foot traffic. It does not require a promotion. It does not require a new product line. It requires that the person already standing in your store hears something that tells them this place was built for someone like them.
The stores playing generic playlists are giving that number back every day. Not because the music is bad, necessarily. Because the music is anonymous.
What You Can Do This Week #
Walk your highest-performing store and your lowest-performing store on the same day. Stand near the entrance for ten minutes in each one. Listen to what is playing. Ask yourself whether the music sounds like it belongs to your brand and your customer, or whether it sounds like it belongs to a dentist’s office, a hotel lobby, or nowhere in particular.
Then call your music vendor and ask them one question: what data are you using to select the tracks in my stores? If the answer is “genre” and “mood,” you are paying for silence-filling. The 8 to 12 percent is still on the table.
A playlist that could belong to any store belongs to none of them.
The numbers side of this argument is laid out for finance teams here. For a broader guide to the levers that move average order value across retail formats, see how to increase average order value in retail.